Checking for non-preferred file/folder path names (may take a long time depending on the number of files/folders) ...
This resource contains some files/folders that have non-preferred characters in their name. Show non-conforming files/folders.
This resource contains content types with files that need to be updated to match with metadata changes. Show content type files that need updating.
| Authors: |
|
|
|---|---|---|
| Owners: |
|
This resource does not have an owner who is an active HydroShare user. Contact CUAHSI (help@cuahsi.org) for information on this resource. |
| Type: | Resource | |
| Storage: | The size of this resource is 57 bytes | |
| Created: | May 22, 2025 at 1:50 p.m. (UTC) | |
| Last updated: | Apr 03, 2026 at 9:32 p.m. (UTC) | |
| Citation: | See how to cite this resource |
| Sharing Status: | Public |
|---|---|
| Views: | 1149 |
| Downloads: | 14 |
| +1 Votes: | Be the first one to this. |
| Comments: | No comments (yet) |
Abstract
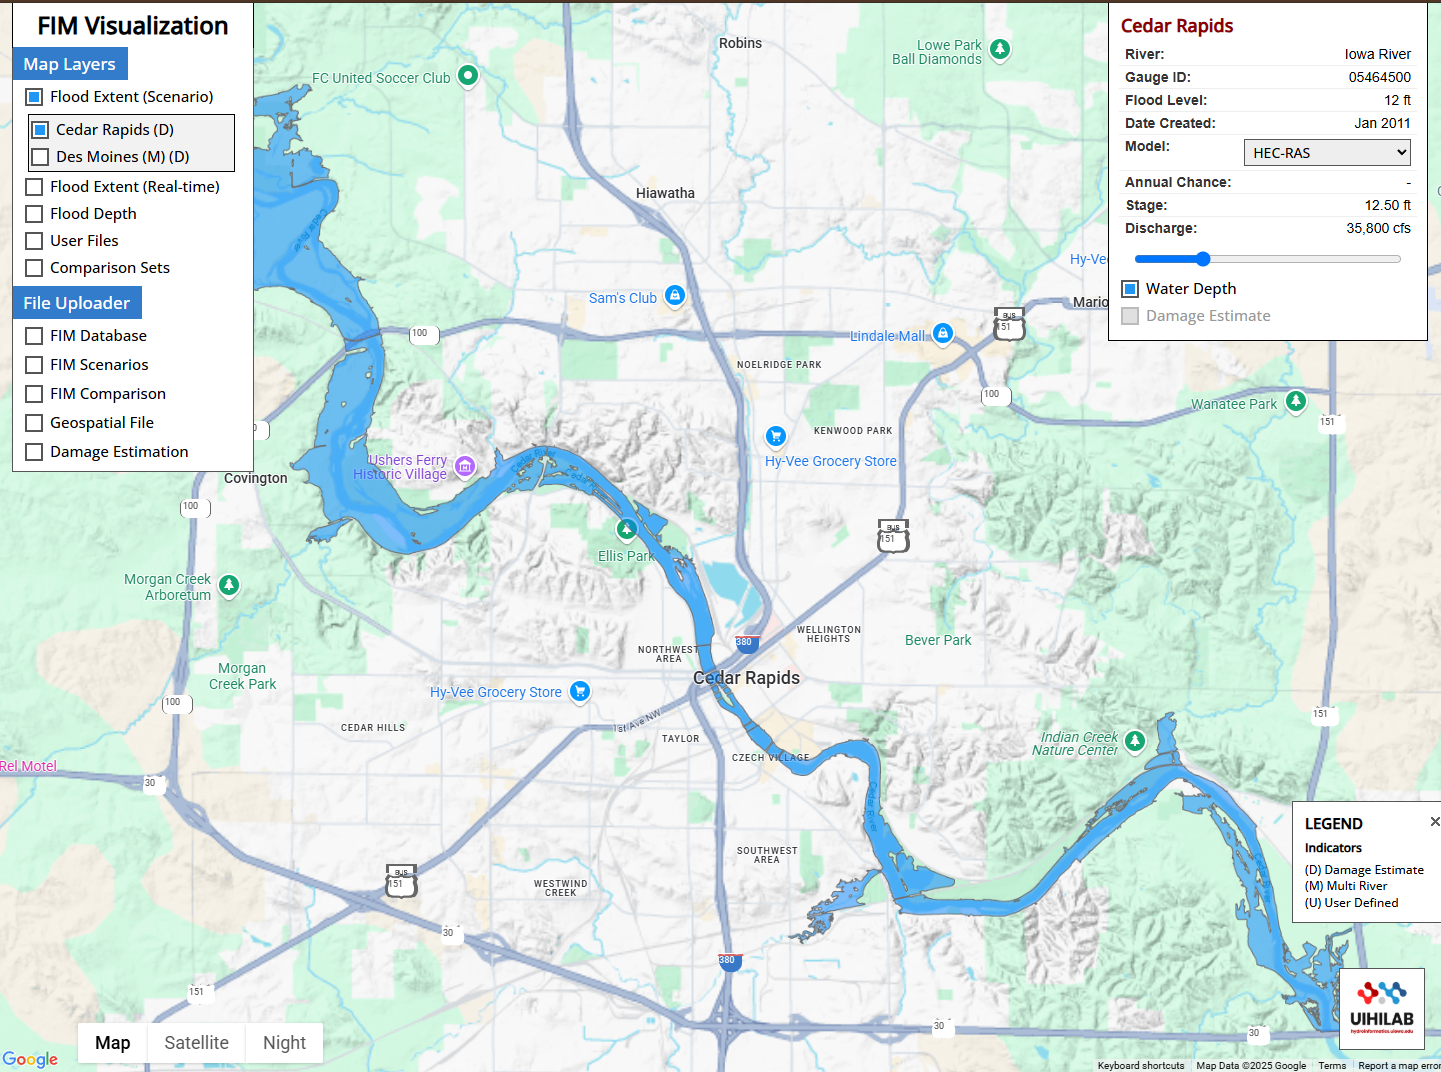
The Flood Inundation Mapping (FIM) Visualization Deck is a web-based application designed to display and compare flood extent and depth information across various temporal and scenario conditions. It provides a front-end interface for accessing geospatial flood data and interacting with mapped outputs generated from hydraulic modeling.
Core Functions:
• Flood Extent Mapping: Visualizes flood extents from modeled scenarios (e.g., 2-year, 10-year, 100-year events) and real-time conditions based on streamflow observations or forecasts.
• Flood Depth Visualization: Displays depth rasters over affected areas, derived from hydraulic simulations (e.g., HEC-RAS).
• Scenario Comparison: Allows side-by-side viewing of multiple FIM outputs to support calibration or decision analysis.
• Layer Management Toolbox: Users can toggle basemaps, adjust layer transparency, load datasets, and control map extents.
Data Inputs:
• Precomputed flood inundation extents (raster/tile layers)
• Depth grids
• Stream gauge metadata
• Associated hydraulic model outputs
Technical Stack:
• Front-end: Built with JavaScript, primarily using Leaflet.js for interactive map rendering.
• Back-end Services: Uses GeoServer to serve raster tiles and vector layers (via WMS/WFS). Uses OGC-compliant services and REST endpoints for data queries.
• Data Formats: Raster layers (e.g., GeoTIFF, PNG tiles), vector layers (GeoJSON, shapefiles), elevation models, and model-derived grid outputs.
• Database: Integrates with a PostgreSQL/PostGIS backend or similar spatial database for hydrologic and geospatial data management.
• Deployment: Hosted via University of Iowa infrastructure, with modular UI elements tied to specific watersheds or study areas.
Subject Keywords
Coverage
Temporal
| Start Date: | |
|---|---|
| End Date: |
Content
Additional Metadata
| Name | Value |
|---|---|
| page_url | https://hydroinformatics.uiowa.edu/lab/fims/ |
| thumbnail_url | https://ciroh-portal-static-data.s3.us-east-1.amazonaws.com/b4f11b9d-c0cb-4052-aebc-e7094e4362f2.png |
Related Resources
| Title | Owners | Sharing Status | My Permission |
|---|---|---|---|
| CIROH Featured Apps | James Dolinar | Public & Not Shareable | Open Access |
Credits
Funding Agencies
This resource was created using funding from the following sources:
| Agency Name | Award Title | Award Number |
|---|---|---|
| National Oceanic and Atmospheric Administration (NOAA), University of Alabama | CIROH: Enabling collaboration through data and model sharing with CUAHSI HydroShare | NA22NWS4320003 to University of Alabama, subaward A23-0266-S001 to Utah State University |
How to Cite
This resource is shared under the Creative Commons Attribution CC BY.
http://creativecommons.org/licenses/by/4.0/
Comments
There are currently no comments
New Comment